Diving animals and tidal turbines
Tidal energy devices are becoming commonplace, particularly in Northern Europe, where several devices have been tested, or are already active. There is a huge potential in this predictable energy source, helping to guide us out of the fossil fuel era. However, high energy tidal environments are also home to a plethora of diving marine animals like seals, dolphins and seabirds. Assessing the risk of collision by particular species' is part of most environmental impact assessments, and is vitally important towards management of our ocean resources; living and otherwise. For a full summary of factors view Page 16, Table 2 of the Scottish Natural Heritage guidance note
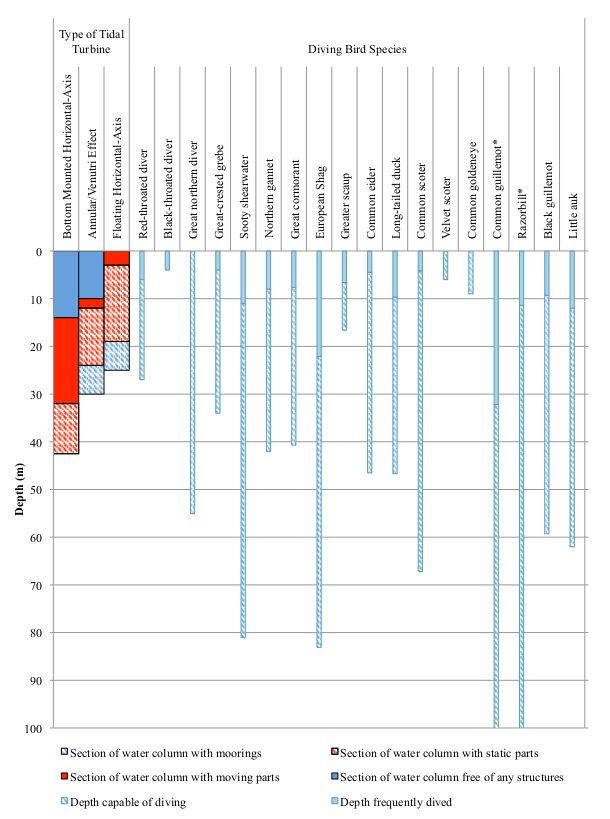
There are many different types of tidal turbines, and some may or may not overlap with certain species.

This is just a short list of a few factors for assessing collision risk (click on the item to learn more):
A sample collision risk model
There are several collision risk models that are used to assess the probability of an animal being struck by a device blade. An early implementation that is still used due to it's overall simplicity is the Encounter Rate Model (ERM) by Wilson et al. (2007). The formula for the ERM is defined as this:
D x Bb(w + 2r)(R + r) x v(1+(u2/3v2))
D =
the ‘prey animal’ density, per m3
B = number of rotors (devices)
b = number of blades
w = the width of a turbine blade, as viewed from the side
R = the length of a turbine blade
r =
the ‘effective radius’ – the clearance required due to the body size of the prey animal
v = the blade speed relative to the water, combining tangential speed and current speed
u = the prey animal’s swim speed relative to the water
Try for yourself!
We have populated all the fields here (except D) for you using data from the SNH Guidance note: (Page 83: Gannet)
See HERE for how we calculated D using data from Penguiness
Your collision risk estimate is:
Calculating D using Penguiness
Here we use Northern Gannet (Morus bassanus) as a case
Previously we defined D as calculated by:
D = DAQ2R/2R
Here we take a slightly different approach for illustration of how to use Penguiness.
NOTE: The method we present below is NOT the recommended approach but is a representation of how the Penguiness database could be utilized in this, or other similar models.
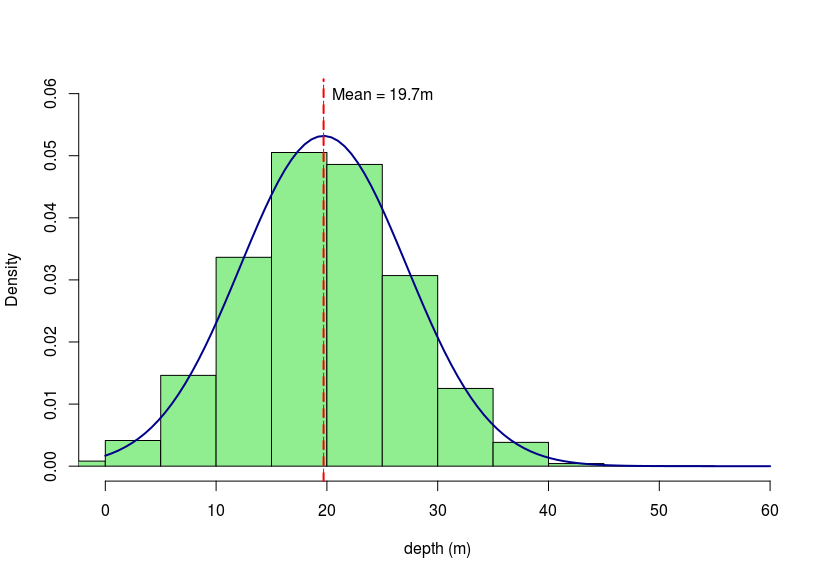
First, we visit Penguiness and find that in Shetland (where our simulated device is found at Fall of Warness), Northern gannets were found to dive on average 19.7m deep with a standard deviation of 7.5. From these values we can simulate a normal distribution which we will assume represents the depths that individuals would dive to over 10,000 dives.

In this case, we'll also assume that the proportion of those dives that occur within the depth band of the device rotors
is analogous to the amount of time an individual might spend at that depth band.
If we assume the device rotors are at a depth of 10 - 35m (diameter of device rotors), we take the proportion of simulated dives that occur
within that depth range (0.885) and multiply it by the density of birds at the surface (birds per m2).
This represents the proportion of individuals who could be at that depth at any time. For our case we assume density to be
0.000001 birds/m2 (equating to 10 birds/km2). This gives a value of 8.85e-07.
We next have to find the density per m3 of birds within the volume of the rotors. We assume a rotor volume (i.e. the overall area device rotors could occupy) of 15625m3 (the rotor length x 2: 253)
We finally assume that for an area directly above the device, according to the proportional density of 8.85e-07, there is only 8.85e-07 birds available for that particular column of water. Thus, to get the volume density we divide 8.85e-07 by the volume of water of interest. In this case, it is 15625m3. This gives us a volume density of birds that could occur in the rotor area of the device of 5.664e-11 birds/m3.
Our formula for Density therefore becomes:
D = (Ds * Pdr) / Rv
Ds = Density of birds/m2 at the surface
Pdr = Proportion of dives that occur within the depth range of the rotors (as determined by simulating using
information derived from Penguiness)
Rv = Volume of rotor area that could strike the bird.
D
Animal density in the water column is calculated by this equation:
D = DAQ2R/2R
DA = the animal density measured in area terms, i.e. animals/m2 at any depth
Q2R = the proportion of animals within the range of depths at risk of collision, from the
greatest to the least depth of a rotor, i.e. twice the rotor radius
R = the rotor radius
**Q2R is entirely dependent on animal behaviour: a shallow-diving species may not dive deeply enough into the water to reach collision risk depth, while a deep-diving species may spend a majority of its time foraging at the sea bed.
The simplest model is to assume that the distribution of animals is uniform over the entire depth range
between seabed and surface. In this case the proportion of time at risk depth is simply that proportion
of water depth occupied by the diameter of the rotor:
Q2R = 2R / water depth
For more information view section 4 of the SNH Guidance
xr
The effective radius:
Take L as the largest dimension of the animal. If the animals were
spherical in shape, the clearance required to avoid an
approaching blade would be L/2, if L is the diameter. If the centre of the animal
comes closer than L/2 to an approaching blade, then it will encounter the blade.
This is greatly affected by the shape of the animal and L/2 is corrected by a 'shape factor' (f).
r = f x L/2
According to section 2.1 of the SNH Guidance, the shape factor for wing propelled diving birds is 0.8, and the shape factor for other species is 0.5.
x